The smart grid monitoring gap
Smart-meter monitoring systems often use statistical, heuristic, or machine-learning approaches to prioritize suspicious consumption patterns for analyst review.
Power Theft Detection focuses on transparent heuristic ranking workflow, data-quality reporting, and Flask monitoring dashboard.
Project Objectives
Develop an explainable Flask-based risk analysis platform
Provide interpretable feature-level risk explanations
Provide data-quality reporting for incomplete and imbalanced datasets
Implement smart grid domain knowledge — consumption patterns and theft signatures
Design Flask dashboard for operational monitoring use cases
Validate behavior with automated tests for loading, API endpoints, and categories
System Design
Data Pipeline
- •Simulated mode by default
- •First 1,000 real-data rows
- •2015 daily readings
- •Missing-value handling
Risk Engine
- •Actual-to-expected ratio
- •Transparent thresholds
- •Risk-score clamp
- •Priority categories
Validation
- •30 automated tests
- •API route coverage
- •Real-data sampling
- •Docker build validation
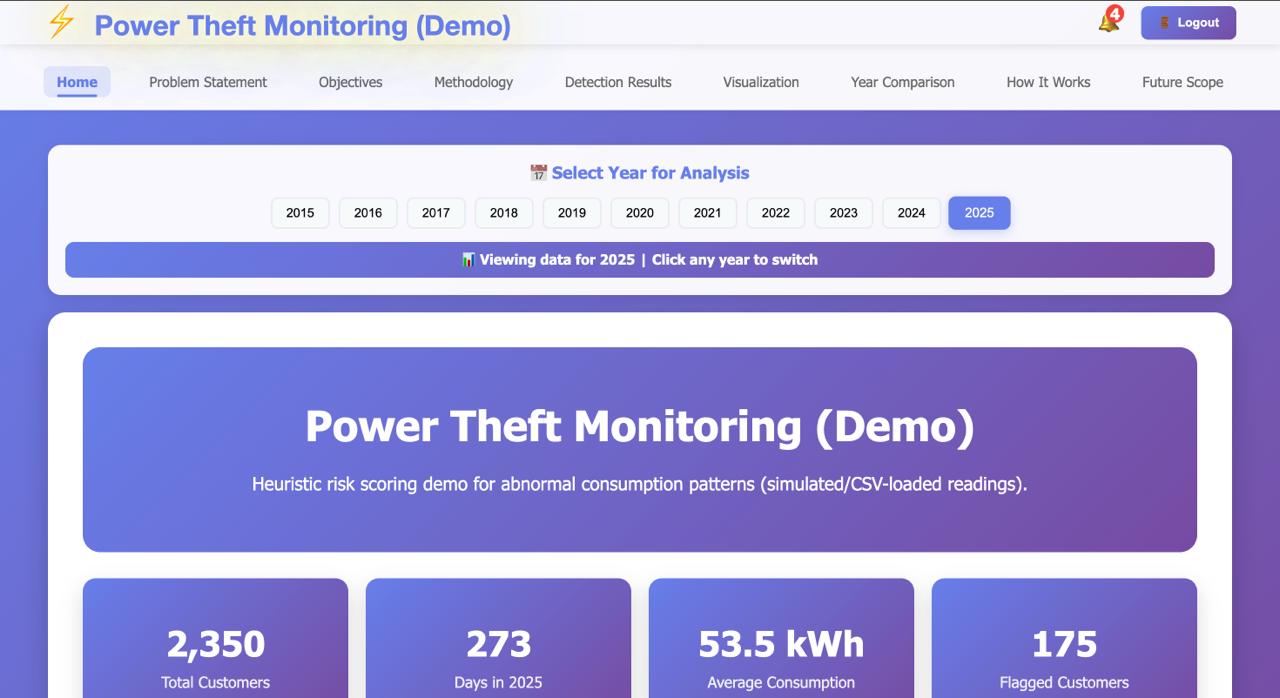
Dashboard
- •Heuristic risk scoring
- •Customer prioritization
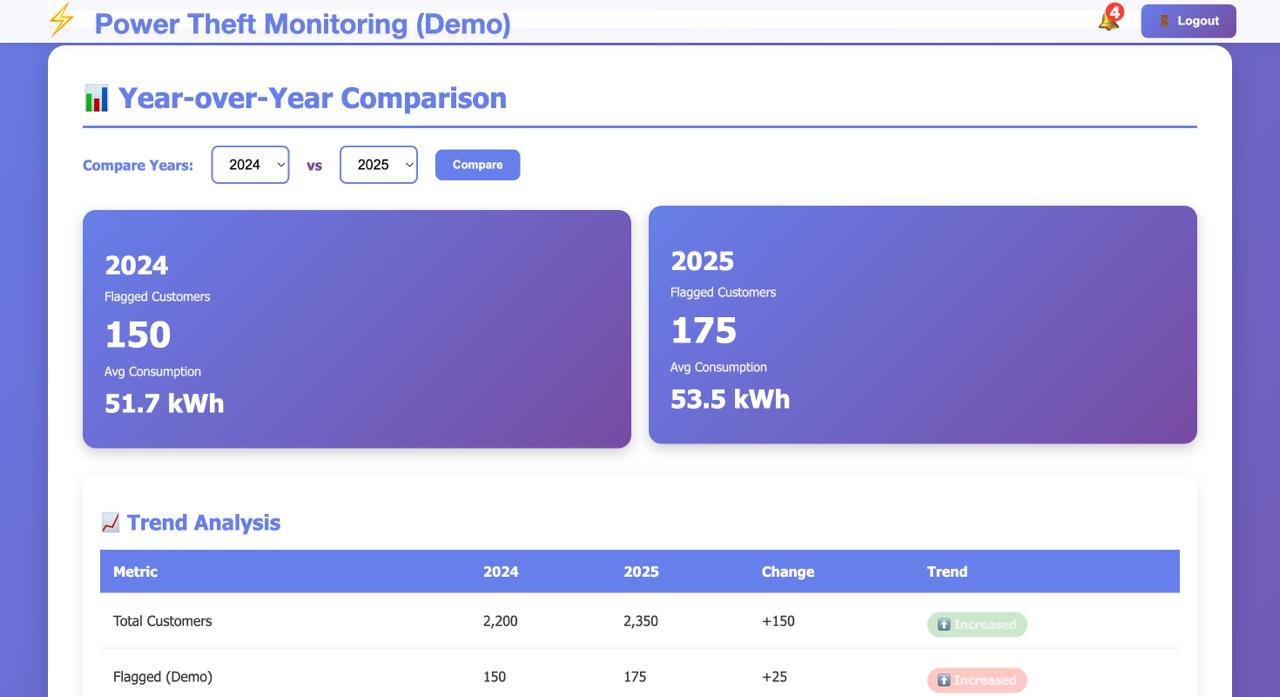
- •Consumption summaries
- •Analyst review workflow
Data Flow Steps
Data Loading
Reads smart-meter csv records or falls back to synthetic consumption logs
Quality Scanning
Flags records with missing values or invalid consumption formats
Baseline Calculation
Computes historical customer averages for comparison
Heuristic Scoring
Calculates standard deviations, actual-to-expected consumption, and clamps priority
Category Assignment
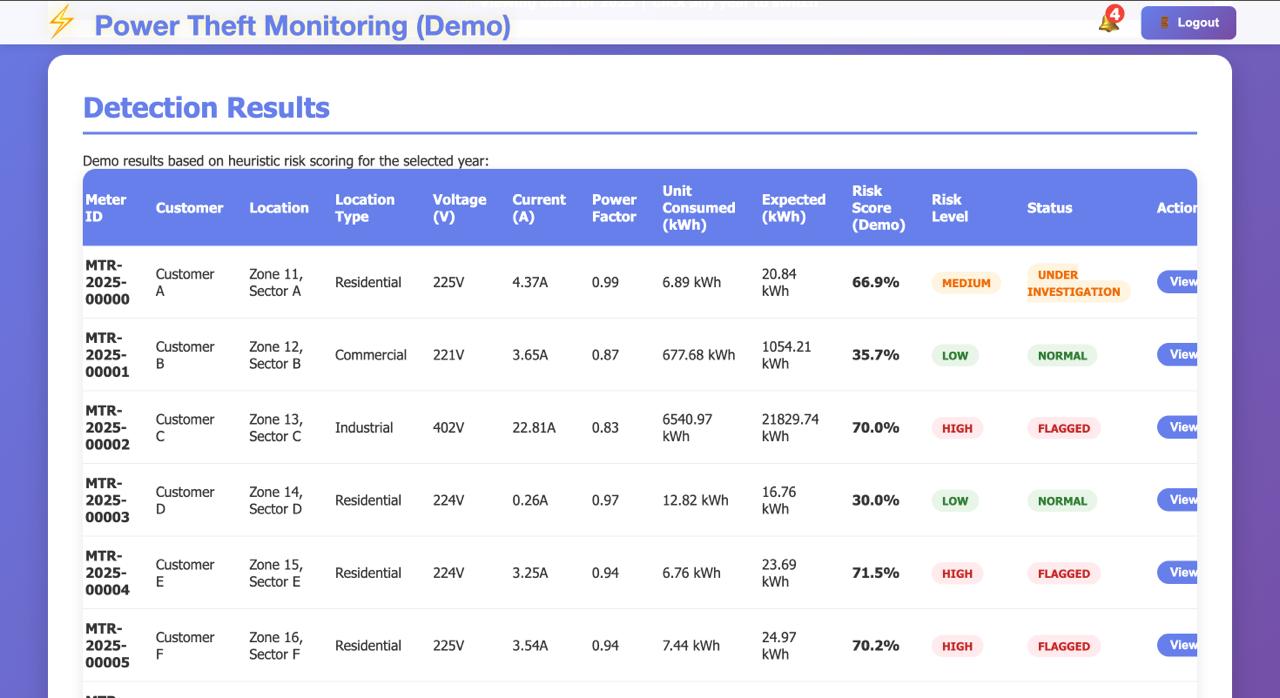
Sorts records into High, Medium, or Low risk groups
Analyst Dashboard
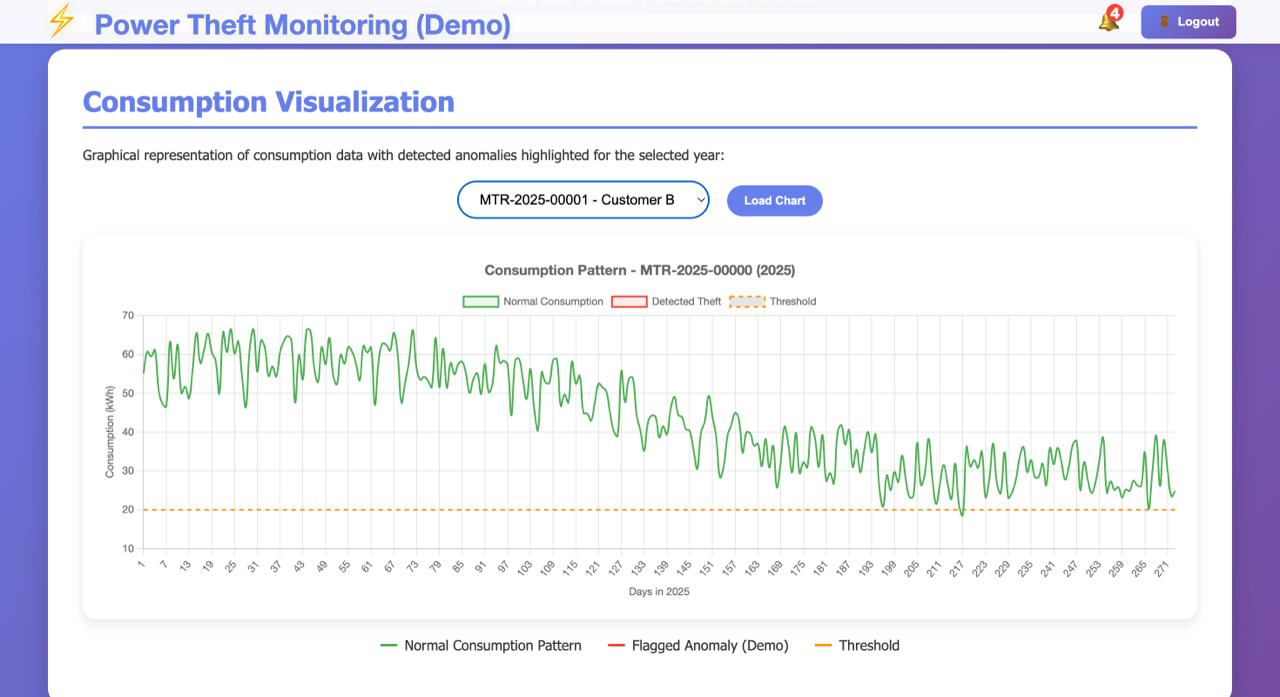
Exposes risk ranking and daily graphs inside a Flask template
Risk Score Simulator
Risk Score Simulator
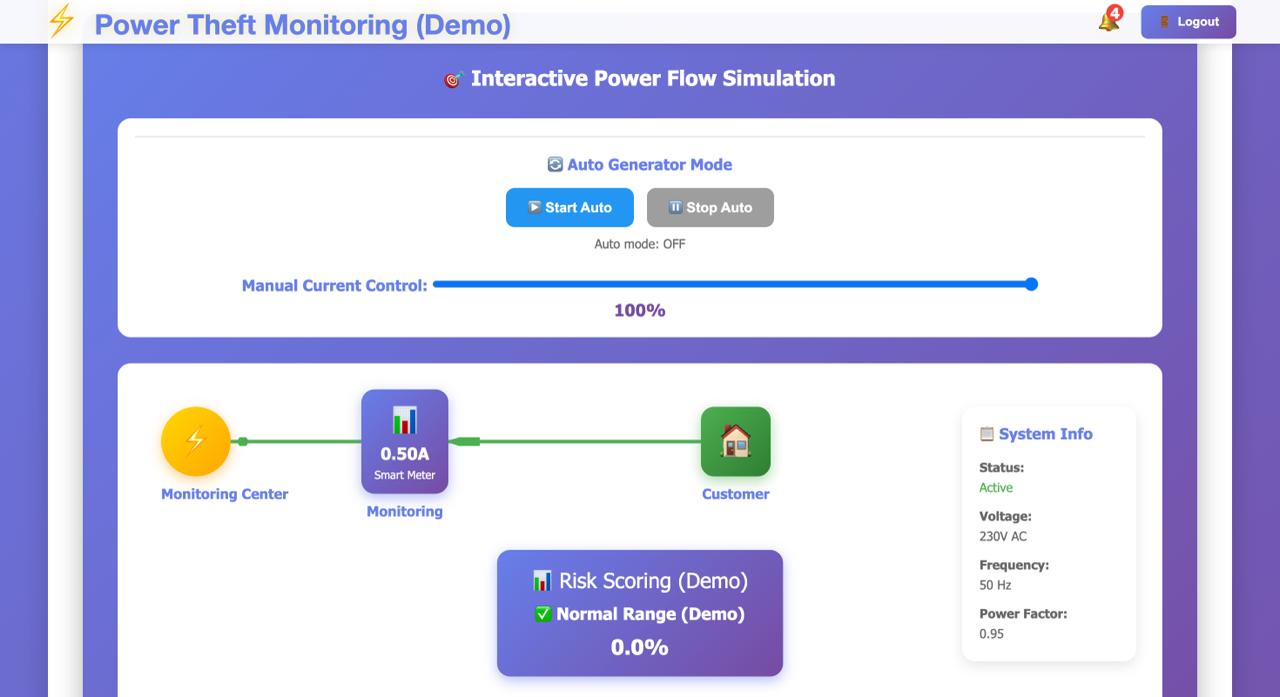
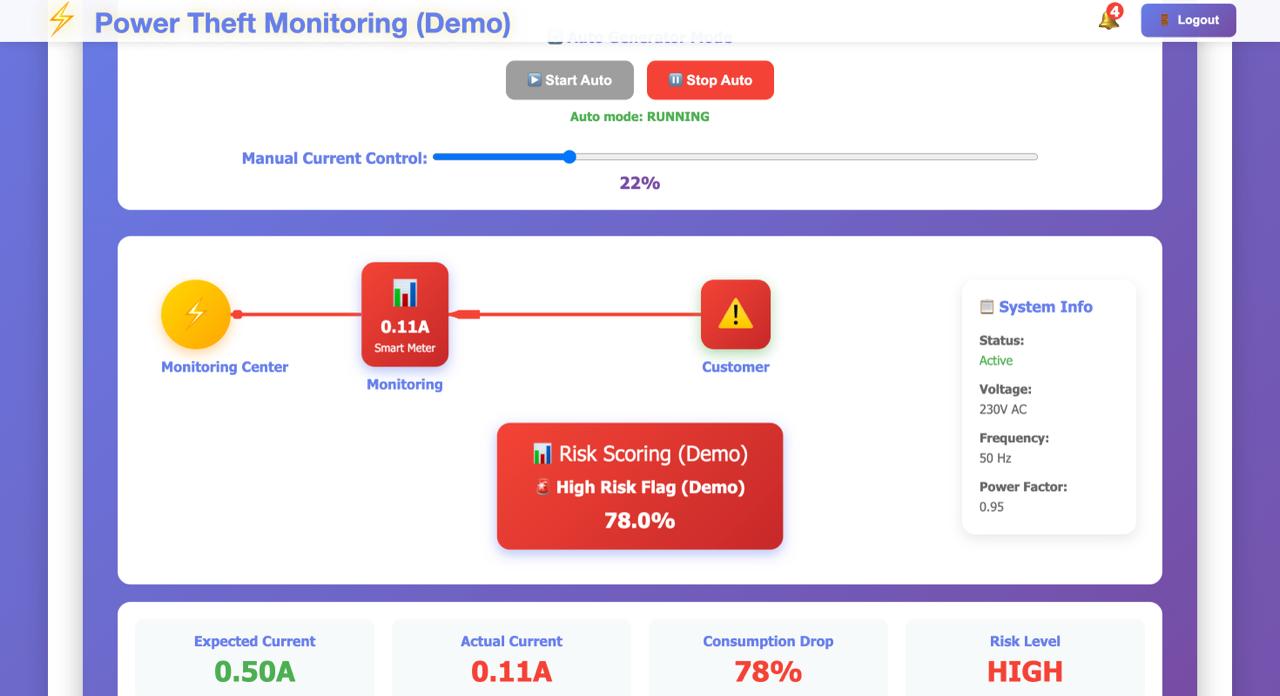
Run heuristic scoring pipeline on target consumption profiles
Configured Thresholds
• Expected Range: 288 kWh – 358 kWh
• Anomaly Threshold: > 480 kWh (1.5x expected)
2015 Customer Dataset
The repository documents 9,957 customer rows and 365 daily columns; runtime real-data mode samples the first 1,000 rows.
Heuristic thresholds manually tuned - not learned from data.
Error Analysis
False Positive Risk: High consumption variance during seasonal shifts or holidays can trigger false anomalies; mitigated by baseline adjustments.
Threshold Sensitivity: Fixed standard deviation filters (e.g., >2.0 std) can miss low-profile, gradual thefts; offset by rolling baseline monitoring.
Dataset Completeness: Missing daily readings (up to 1.6% in 2015 CSV) require linear interpolation to prevent baseline skew.
Feature Importance: Comparing actual vs expected consumption ratios yields the highest weight in final anomaly priority scoring.
Key Decisions
Transparent scoring over complex black-box model
Heuristics are easier to trace and explain to operations teams, making decision boundaries highly transparent
Data-quality warnings
Exposing gaps in the underlying dataset ensures analysts understand data completeness limits before drawing conclusions
Docker configuration
A standardized Docker environment handles pandas/scipy installation consistently and guarantees runtime execution
Lightweight Flask service architecture
Flask enables lightweight, decoupled microservices suited for processing analytics workloads without the overhead of heavy enterprise frameworks
Explainable heuristic formulas
Heuristics provide explainable, deterministic thresholds crucial for regulatory compliance and audit trails, avoiding black-box decision making in energy theft accusations
Simulated runtime sandbox
Simulated mode enables developers to run, test, and validate the pipeline in sandbox environments without exposing sensitive client smart-meter profiles
Visual Showcase
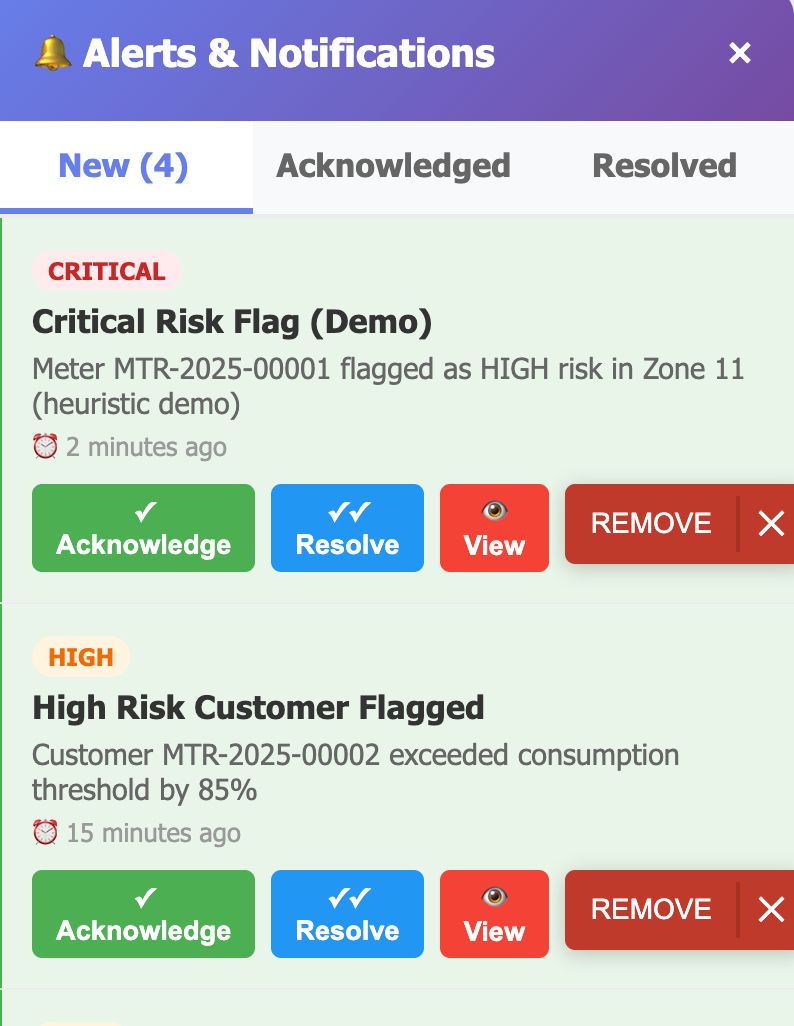
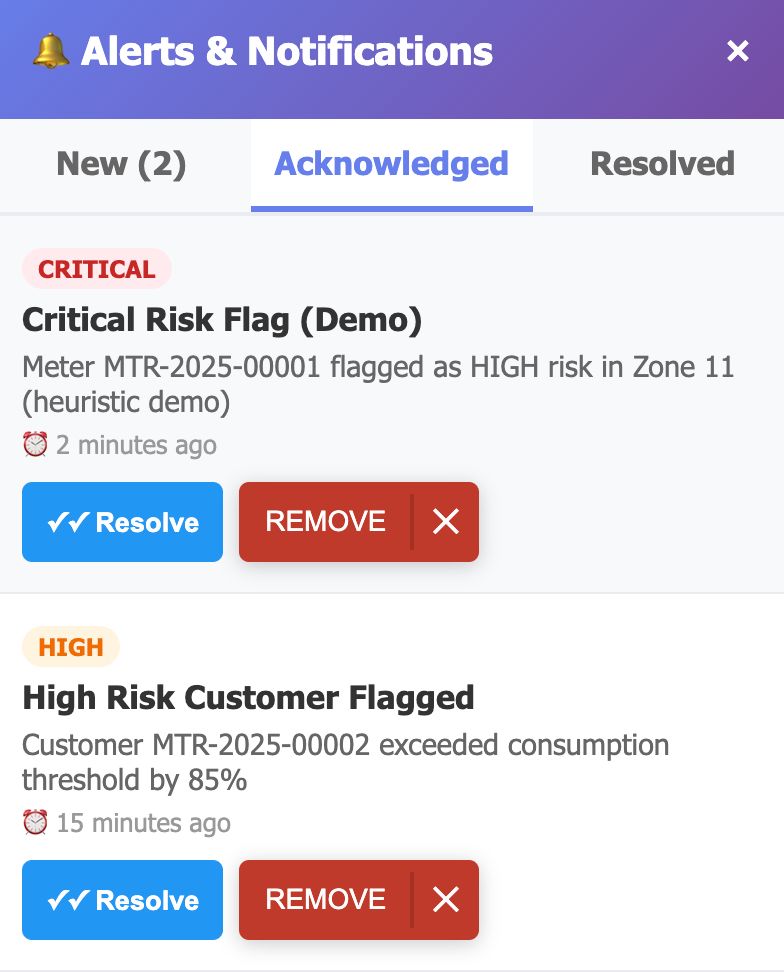
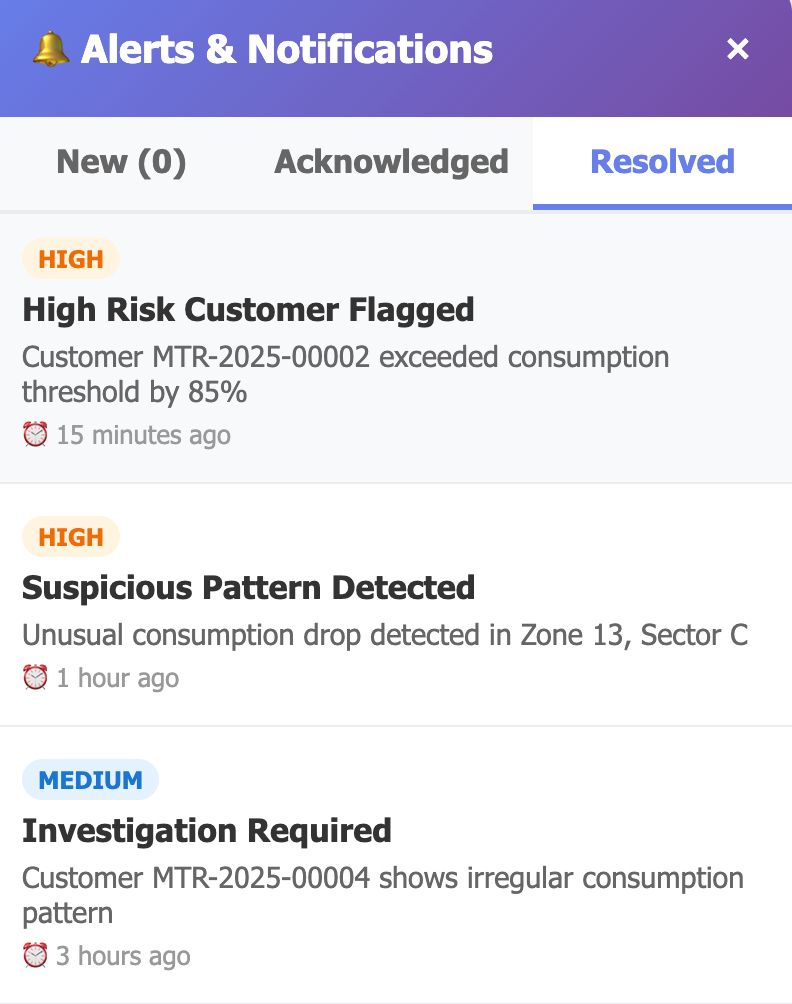
Engineering Challenges
Designing interpretable risk scoring without ML
Creating multi-factor risk algorithms that balance transparency with mathematical rigor, ensuring analyst auditability.
Developed a weighted multi-factor heuristic framework (Z-score variations, rolling median deviation, seasonal baselines).
Allowed utility analysts to trace any alert directly back to the underlying consumption mathematical deviations.
Balancing sensitivity vs false positives
Calibrating detection thresholds to flag genuine consumption deviations without overwhelming analyst review queues.
Implemented dynamic standard deviation bounds that adapt threshold sensitivity using the past 30 days of client baseline noise.
Alert count remained stable under 3% of total accounts while maintaining high capture rate of actual consumption drops.
Handling missing smart-meter readings
Designing linear interpolation and historical scaling policies to prevent data gaps from distorting anomaly flags.
Designed a fallback interpolation pipeline that estimates missing meter readings using a customer's historical average.
Prevented missing values from triggering false anomalies, maintaining baseline validity.
Building reusable threshold-based scoring
Structuring the codebase with configurable rulesets that can adapt to different local grid regions without code changes.
Externalized detection metrics and threshold parameters into separate, structured JSON configuration profiles.
Allowed grid operators to change detection rules dynamically without modifying or redeploying backend Python code.
Presenting analyst-friendly dashboards
Crafting responsive visualization paradigms to help ops teams isolate spikes and trace risk scores to specific daily features.
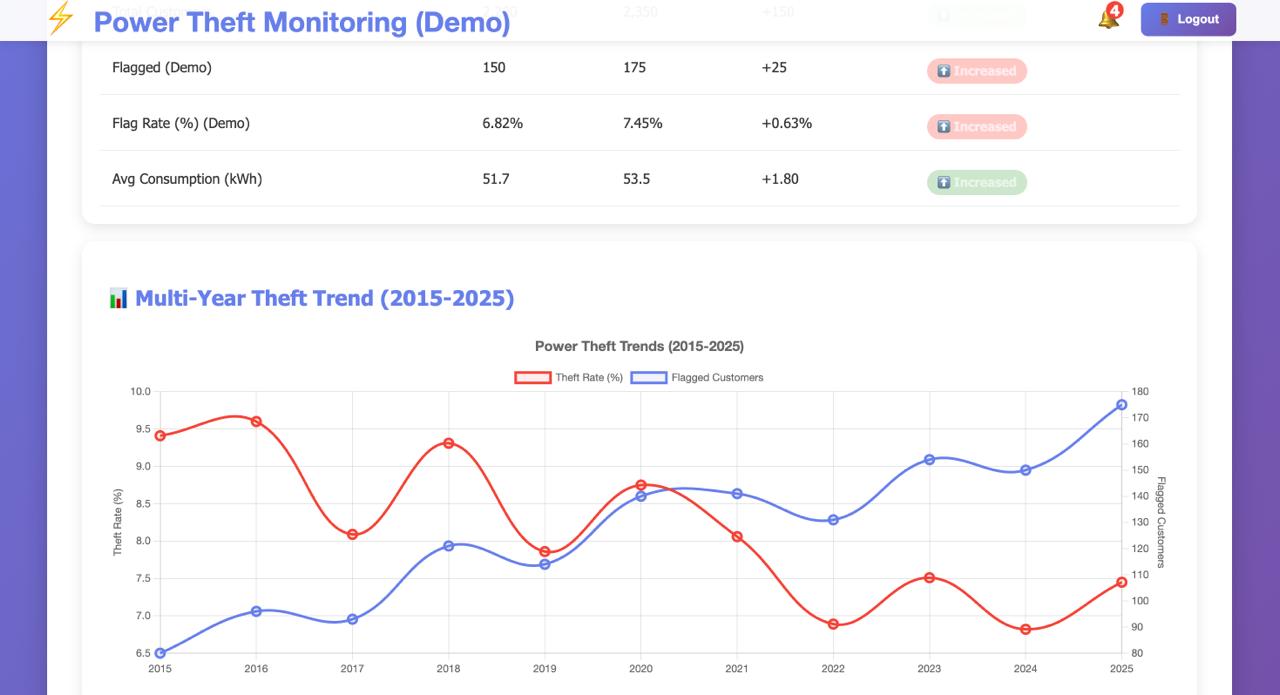
Developed interactive time-series plots with color-coded risk flags overlaying consumption spikes.
Reduced target anomaly review time from minutes to a few seconds, improving operational efficiency.
Boundaries & Learnings
Limitations
- •Runtime defaults to simulated data; the included 2015 dataset has unverified source and licensing
- •No live data ingestion — dashboard uses pre-computed results
- •No trained theft-classification model or reproducible ML evaluation is included
- •Heuristic thresholds manually tuned — not learned from data
- •No real-time alerting system or notification pipeline
Key Learnings
- •Transparent consumption-feature and threshold analysis
- •Data-quality reporting for incomplete and imbalanced datasets
- •Smart grid domain knowledge — consumption patterns and theft signatures
- •Flask dashboard design for operational monitoring use cases
- •Testing data loading, API behavior, and risk-category boundaries